The Pivot Table is a tool for Excel that allows you to group data in a table and display them in an orderly fashion.
It also lets you customize and then choose how to represent data.
You can also use filters that automatically creates, or create new ones at will.
But let's start with a concrete example.
1) We start from a table where there are registered names and amounts and months of recovery.

2) Select the entire table with the mouse, which for each column must have a title, eg. Date, client, etc..
Then choose the paper "Insert" and click "Pivot Table"

3) At this point, this indication appears, which determines the area of your pivot table, then click "OK".

4) At this point, the system creates a new sheet, showing the fields in pivot table that we can use (which are nothing more than the titles of the columns).

5) If we choose eg "customer" the system places on the lines of the column names all customers.

6) Now we choose, and then drag the mouse with the other fields you want to appear on the field tabella.Quindi "Amount" box sum, the field "Month" in the Label column.
In this way we created a table with the names left on the lines, the months above the columns, and the amounts for the month and names in the middle.

7) At this point we place a figure anywhere in the center of the tables, click on the right mouse button and choose "Set field value".

8) and choose "Sum", for the sum of the amount per month per customer.

9) And now the table gives us the amount we wanted.

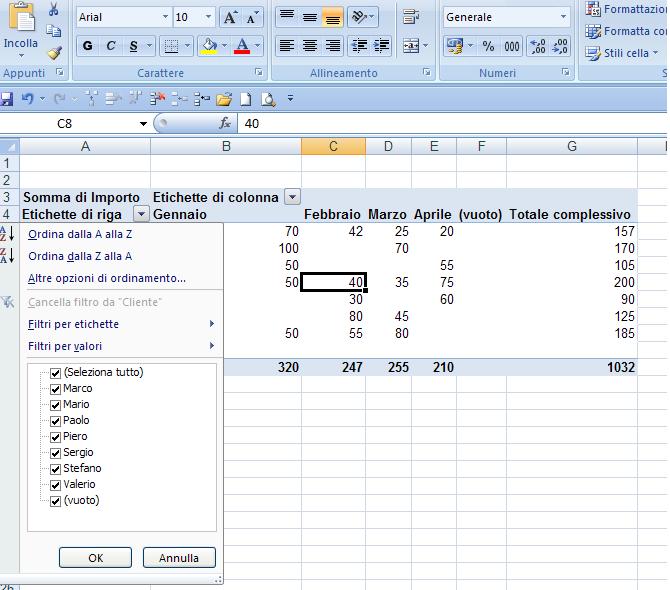
10) The table is now complete, and gives us the data we want, but we can use filters to modify the extraction of data at will.

11) The filters allow us to see for example some "customers"

The pivot table can also be used in other ways, such as the inclusion of other filters. In addition we can also create other Pivot tables on the same card, without any problem, as it automatically creates another EXCEL spreadsheet.
Another very useful property of the table, is that if you click on any value it provides us (creating another sheet) detailing all the data they have generated that total.
Example, do we do double-click on the total (200) line "Piero".

EXCEL automatically created a new piece of paper makes us see the full detail of all rows that have generated the total 200.

These sheets can be created automatically deleted without any problem, because even if we need to get back the details just click back on the amount involved.
Ultimately PivotTables are a powerful and easy tool for analyzing and grouping data, we can create with reference to any table.
It also lets you customize and then choose how to represent data.
You can also use filters that automatically creates, or create new ones at will.
But let's start with a concrete example.
1) We start from a table where there are registered names and amounts and months of recovery.

2) Select the entire table with the mouse, which for each column must have a title, eg. Date, client, etc..
Then choose the paper "Insert" and click "Pivot Table"

3) At this point, this indication appears, which determines the area of your pivot table, then click "OK".

4) At this point, the system creates a new sheet, showing the fields in pivot table that we can use (which are nothing more than the titles of the columns).

5) If we choose eg "customer" the system places on the lines of the column names all customers.

6) Now we choose, and then drag the mouse with the other fields you want to appear on the field tabella.Quindi "Amount" box sum, the field "Month" in the Label column.
In this way we created a table with the names left on the lines, the months above the columns, and the amounts for the month and names in the middle.

7) At this point we place a figure anywhere in the center of the tables, click on the right mouse button and choose "Set field value".

8) and choose "Sum", for the sum of the amount per month per customer.

9) And now the table gives us the amount we wanted.

10) The table is now complete, and gives us the data we want, but we can use filters to modify the extraction of data at will.

11) The filters allow us to see for example some "customers"
The pivot table can also be used in other ways, such as the inclusion of other filters. In addition we can also create other Pivot tables on the same card, without any problem, as it automatically creates another EXCEL spreadsheet.
Another very useful property of the table, is that if you click on any value it provides us (creating another sheet) detailing all the data they have generated that total.
Example, do we do double-click on the total (200) line "Piero".

EXCEL automatically created a new piece of paper makes us see the full detail of all rows that have generated the total 200.

These sheets can be created automatically deleted without any problem, because even if we need to get back the details just click back on the amount involved.
Ultimately PivotTables are a powerful and easy tool for analyzing and grouping data, we can create with reference to any table.